How to Use the Baltimore LTER Viewer
Welcome!
The Map
Displayed Plot locations have been modified to mask their exact location and extent in order to maintain their statistical integrity and therefore preserve them for year to year comparison. The locations you see are approximate.
Likewise, the Plot areas are not to scale and are shown for display purposes only. Use the larger circle size for when you are zoomed out so that they are easier to see. When zoomed in, use the smaller circles size so as not to clutter the base map.
Plot circles may be thematically colored by various attributes present in the viewer. The color gradient of the thematic mapping is based on a 10 level, equal interval scale with lighter colors indicating less of an attribute and darker colors indicating more of an attribute. The scale is developed based on the attribute’s minimum and maximum values.
The Datatable
Some plots may appear to be missing from the table. Plots that were not marked as complete are not included in the table.
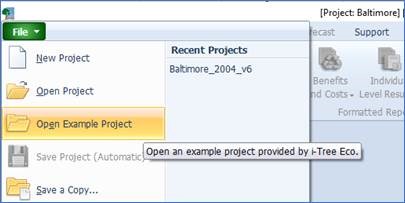
Downloads
Project files can be downloaded via the Download button on the toolbar, or the Downloads link in the header. Please note that all project files have been cleansed of location-identifying data.
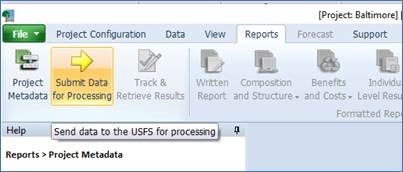
Downloaded data will be in the form of a compressed, or "zipped", i-Tree Eco project file and will require i-Tree Eco to open and work with it. This PC software is available free of charge at www.itreetools.org. Once you have installed it, you can use i-Tree Eco > File > Open Projects to navigate to your downloaded and unzipped file. As i-Tree Eco is updated regularly, you may need to upgrade the project file, and you will need to resubmit it for processing to view the latest reports.